Smell-O-Vision

Background
This project has been a collaborative effort between myself and M Dougherty. I was incredibly excited to participate in their vision: to create an interactive, sensory experience with visuals and scents.
Planning
After some planning and feasibility experiments we decided to aim for an interactive environment that utilized camera based position detection to find the number of individuals in a space, the center point between them, and some other metrics discussed here. These datapoints would power a visualization using the P5 library and trigger scent diffusers around the room.
My primary role was to develop the machine learning integration, linking it with a live webcam and tuning it for performance in low light. M tackled hacking the diffusers so that they could be triggered from a single arduino. We both collaborated on the artistic direction for the visuals.
Execution
Visuals
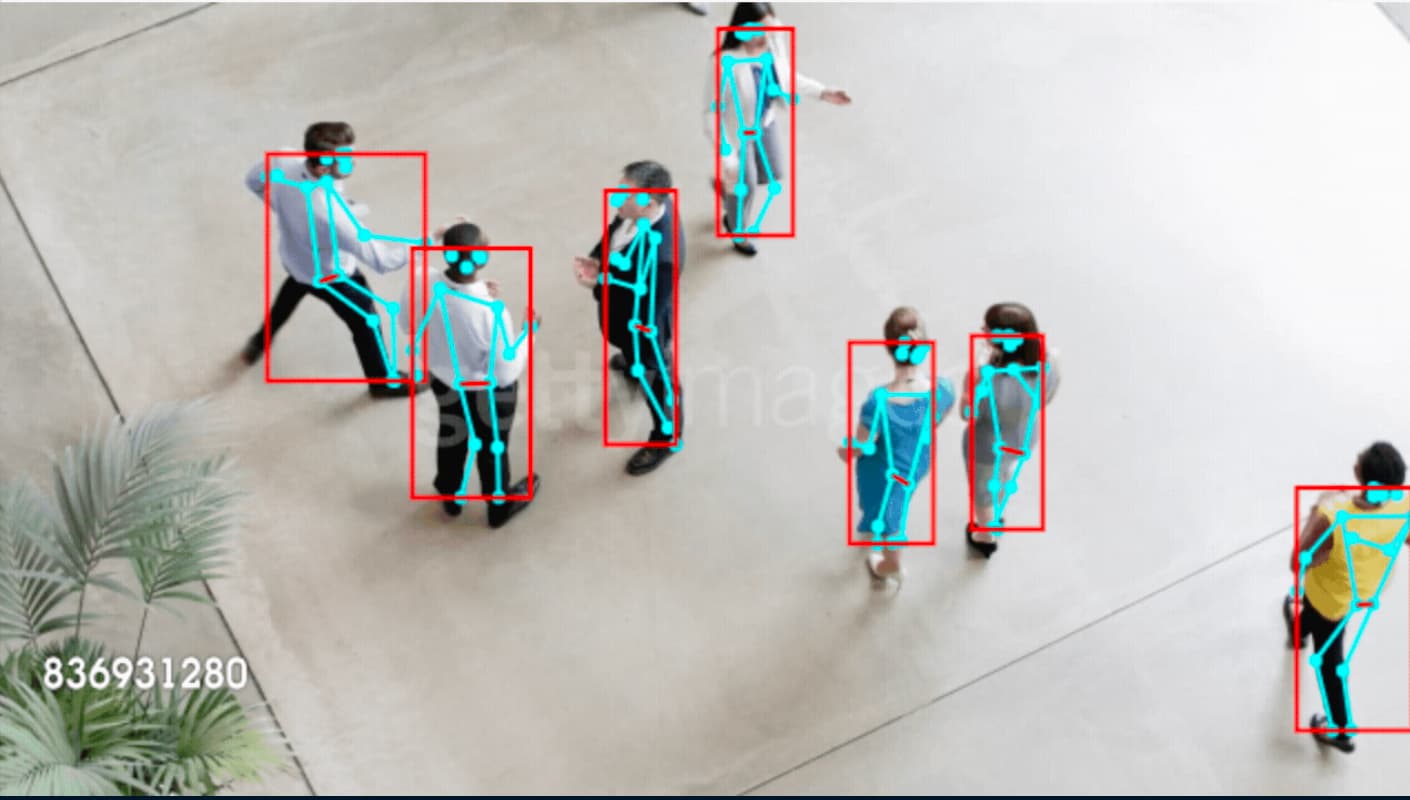
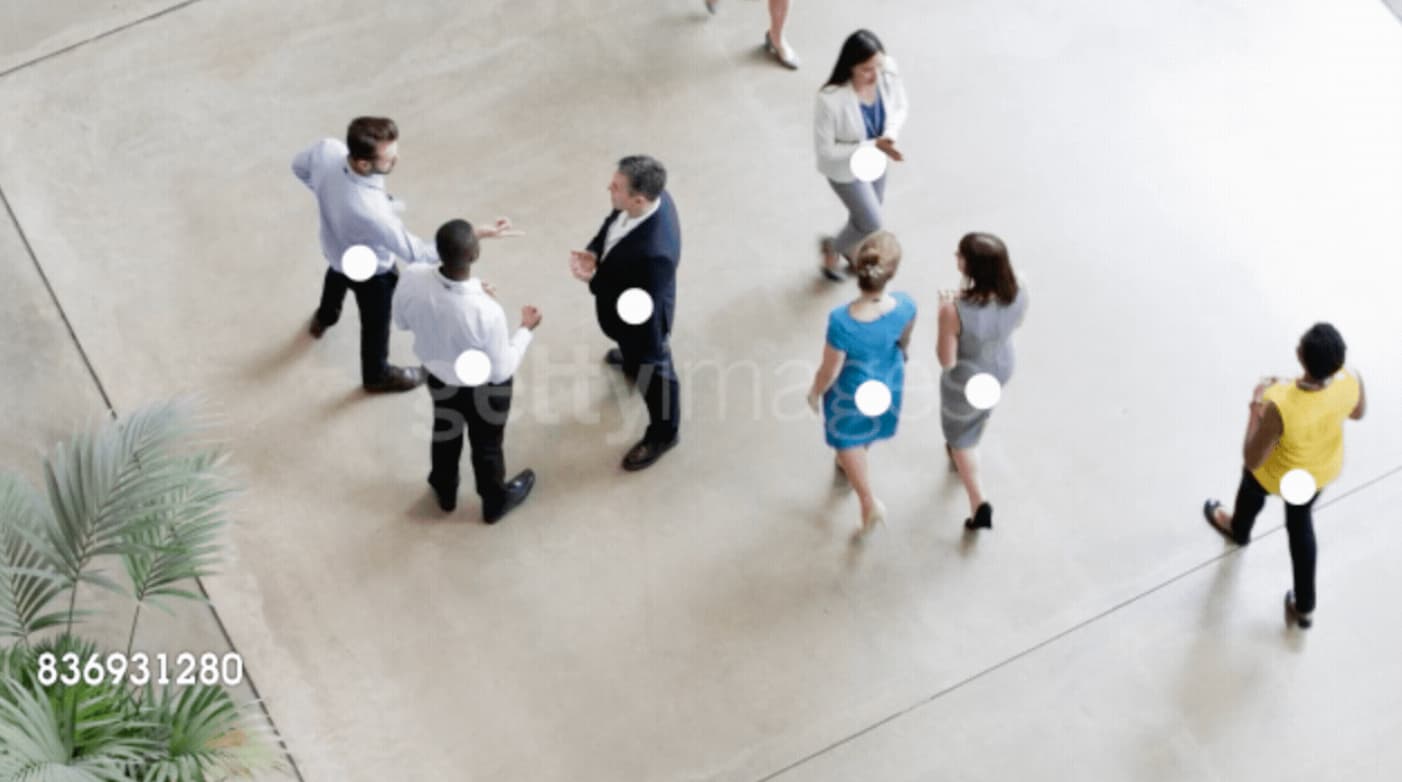
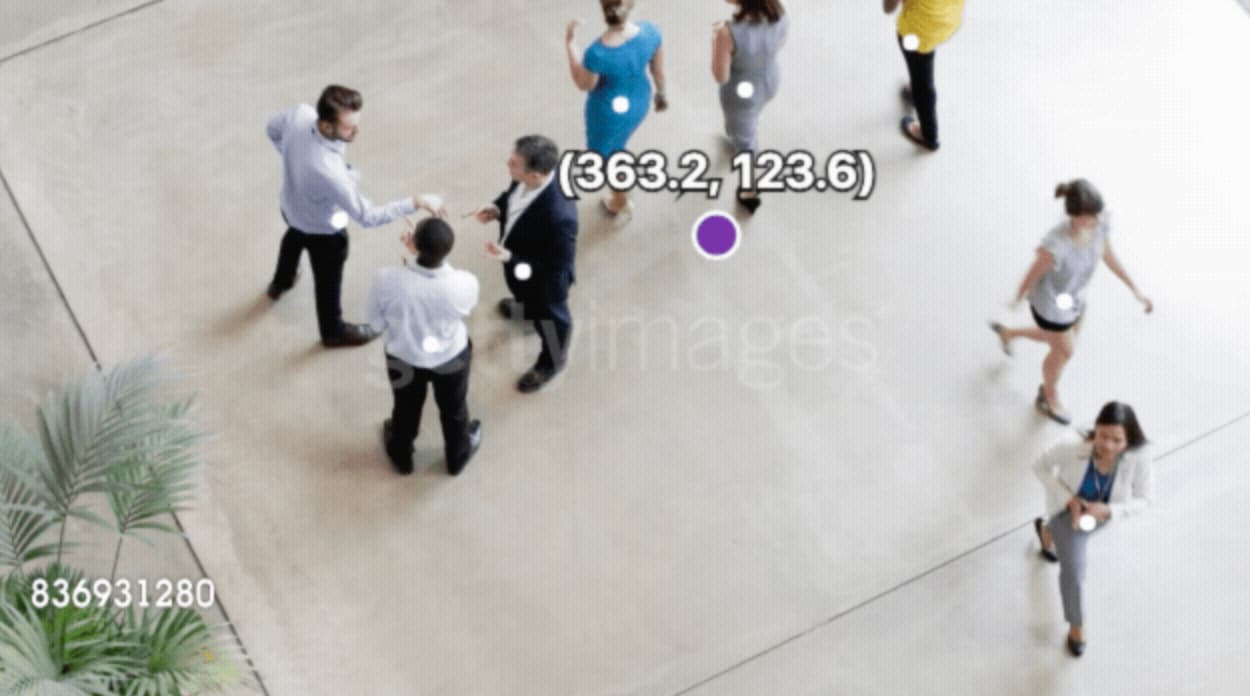
My previous post discussed the basic setup of the Posenet machine learning model. As it turns out the most useful data points for our v1 were the number of individuals (poses), and their average X and Y coordinates in the room. The white circles in this photo represent individual poses; the purple circle is the center point for the group.
Feeling pretty good about the model’s ability to handle stock footage, my next mission was to experiment to find possible visualizations that could use this data. Our initial attempts at visuals used the HSB colormode and had a pretty brutal color palette no matter the saturation. The results of my experimentation were maybe interesting but they weren’t much better I think.
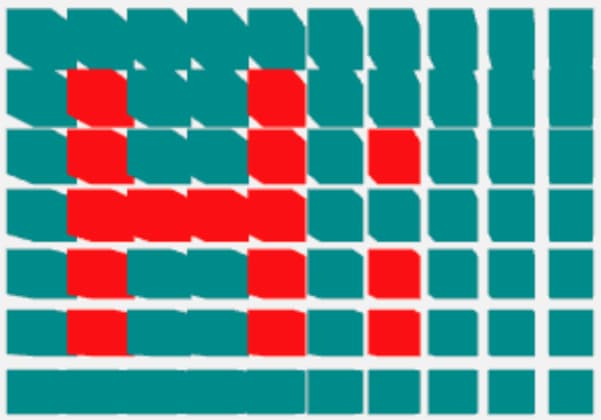
Our initial, HSB visual for experimentation

These inky blobs came from modulating the hue

This one I affectionately refer to as "Loony Tune Brain Freeze"
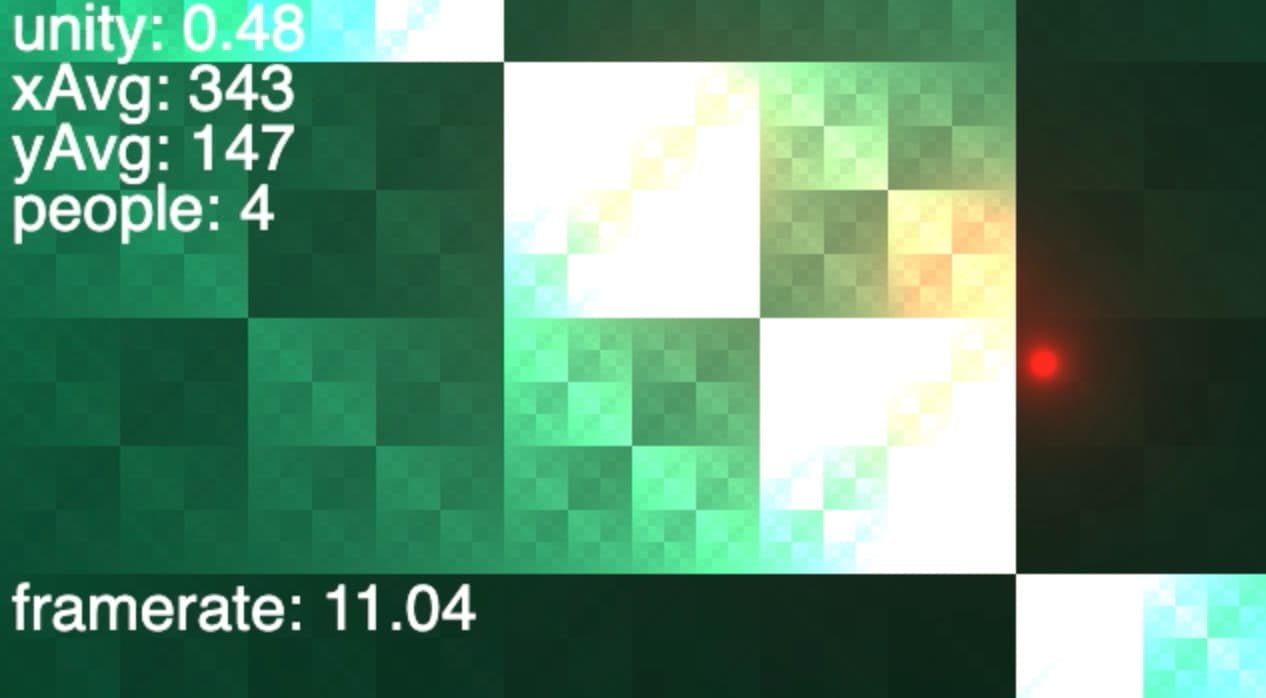
Glassy artifact from setting colorMode per pixel 🙀
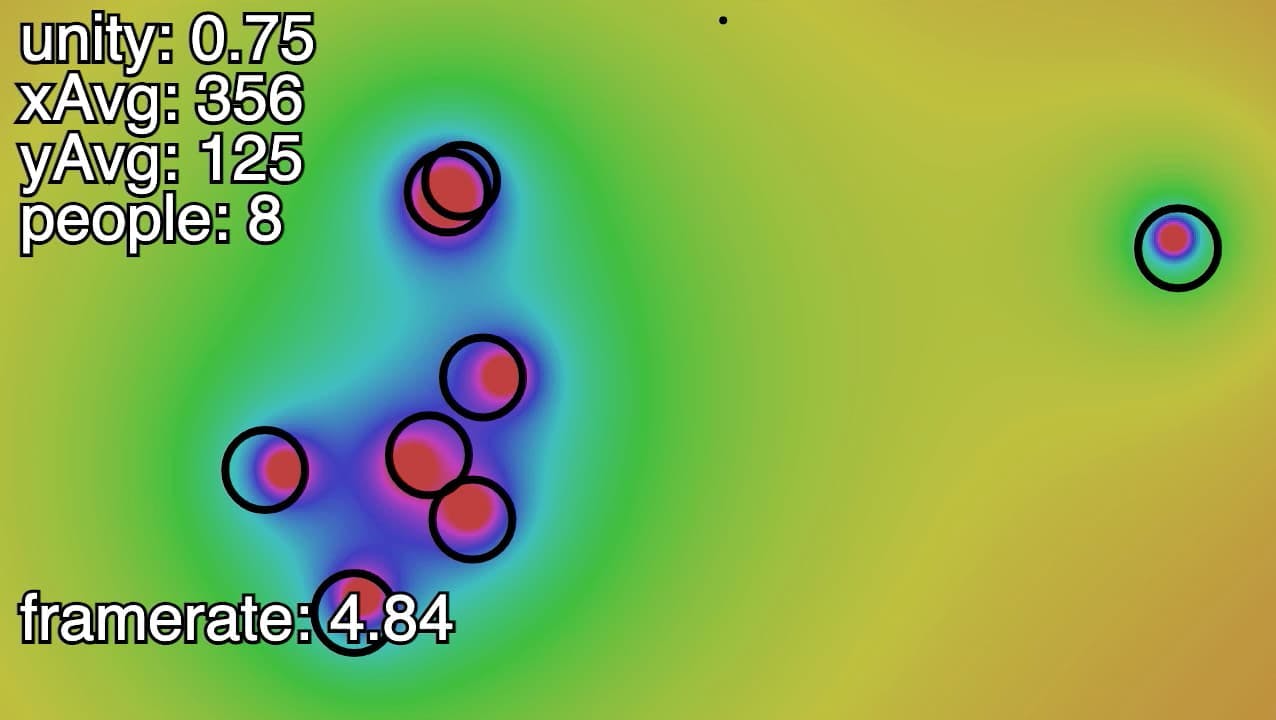
In the end, we knew that we wanted four different color scenes in each corner and that they should be at least vaguely red, blue, green and yellow. After a few days of experimenting, our solution was pretty simple. Whenever the groups central point crossed into a new zone, we draw the blobs in standard RGB color mode using only the channel that corresponds with that zone.
Performance
After settling on a visual aesthetic, the performance of our visualization (as measured with frame rate) was starting to chug and lag. I found that the most impactful improvement was significantly shrinking the P5 canvas size, then scaling it up in the browser with CSS. This ended up creating some weird misalignments between the generated Posenet positions and the newly distorted canvas. However, after correlating the video, canvas, and Posenet input resolutions, it effectively solved all of our animation lag problems.
Installation Issues
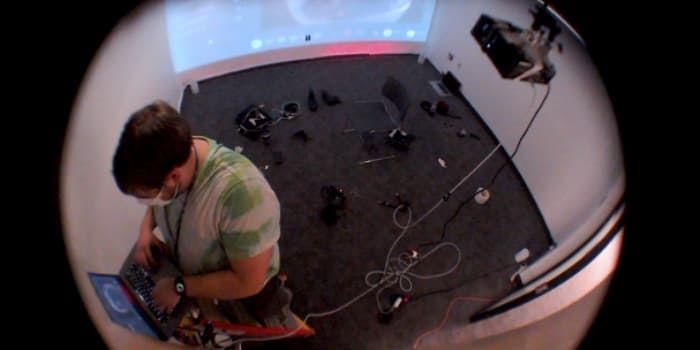
At this point, we felt comfortable beginning to move our work into our installation space (a conference room at the NYU ITP campus). When using a proper webcam instead of the my Macbook’s, we ran into quite a bit of trouble finding a place for the camera due to a change in aspect ratio. We wanted the lights to be as dim as possible to enhance the visibility of the projection, but this lower light caused Posenet to struggle. In addition, we had a hard time finding a position for the camera that could see the room in its entirety. As a result, we couldn’t get any blobs to appear.
Installation Solutions
After another series of video and canvas size tweaks, we got some poses, but they would disappear eratically due to the lighting. After some experimentation, our current solution is two-fold: adjust our code to permit poorer quality poses and using post processing software to increase the exposure. It’s a super fine line between under and over detection (more blobs than people), but I’m pretty happy with the balance we’ve tuned it to at the moment.
Finally, for the camera positioning, we simply couldn’t manage to find a position that included the four quadrants of the room; I wished out loud for one of those iPhone fish eye lenses so we could tape it to the webcam. A few minutes later – in a moment of pure magic – M comes into the room brandishing a tragically unused gift from their mom: an iPhone fisheye lens. To the great delight of M’s mother, it worked like a charm.

Takeaway
This project was a tremendous opportunity for me to experiment with a variety of topics from machine learning, to animation, performance, and visualization. Historically, I have a difficult time delegating and trusting partners. This project, with it’s size, scope and deadline, would have been impossible task alone. However, with our shared creative vision and work ethic, M and I were able to create something really special. Getting to experience the gestalt of a truly collaborative, creative endeavor has been an incredibly rewarding lesson I’ll carry with me.